Psychometric values: what are they and how do you use them?
How do you ensure exam questions are fair and reliable? The answer lies in ‘item analysis’ and exam developers often rely on this to ensure their exams are consistent and effective. ‘Item analysis’ typically tells you more about the quality and reliability of individual items (questions) and of the test as a whole. This article will introduce you to the world of item analysis and psychometric values, explain its significance, and show you how to use it effectively to design better exams.
Why is ‘item analysis’ important?

Whether you are conducting a test for recruitment, certification or admission to a study or school, it is crucial that the test is reliable, valid, and fair. A reliable test delivers consistent results, while validity ensures it accurately measures the intended skills or knowledge.
It is especially critical in high-stakes scenarios where exam outcomes can shape careers or people’s future. With so much on the line, conducting thorough item analysis is both a practical necessity and a moral responsibility, ensuring that every question contributes meaningfully to a fair and accurate evaluation.
Today, item analysis is more accessible than ever before: calculating statistical values is no longer a specialist’s task, but the calculations are done for you by any self-respecting e-assessment platform. This allows not only laymen in statistics to easily interpret the quality and reliability of their tests and questions, but it also enables a broader audience to access these actionable insights immediately.
What are psychometric values?
Psychometric values are an essential part of item analysis. But what are they, and why should you care? In an exam context, psychometric values refer to statistical metrics that assess the quality and effectiveness of exam items and the exam as a whole. These metrics help you determine for example:
- how well the exam differentiates between high and low performers;
- how consistent an exam is;
- how well it measures the intended knowledge or skills.
Psychometric values are mostly used for high-stakes exams conducted on a large scale. That is because these exams need to be both reliable and consistent, and large data sets make the analysis more accurate. Now, let us take a closer look at the most common psychometric values that are part of the item analysis.
p-value
The p-value evaluates the difficulty of the exam items. A low p-value suggests a more difficult question, while a high p-value indicates that the question is easier. It helps examiners understand how well each question performs in distinguishing between different levels of the candidate’s ability.
P-values range between 0 and 1, with
- 0 meaning that every candidate answered the question wrong,
- and 1 meaning that every candidate gave the correct answer.
This means that the easier the question, the higher the p-value will be. Typically, a p-value between 0.3 and 0.7 is considered ideal for most exams.
What is an ideal p-value?
For open questions and questions with a chance of guessing that equals 0 or almost 0 (multiple response, matching and sorting questions, etc.) the ideal p-value is 0.5. For a multiple-choice question (MCQ), this is different because there is a greater chance of guessing the correct answer. The ideal p-value should be higher for these types of questions. The table below summarizes the ideal p-values for MCQs based on the number of answer options:
| Number of options | Ideal p-value |
| 2 options | 0.75 |
| 3 options | 0.68 |
| 4 options | 0.63 |
| 5 options | 0.60 |
Rit-value and Rir-value
Both the Rit-value and Rir-value evaluate the correlation (R) of the item (i) with the exam, but there is a slight difference between the two.
Rit-Value
The Rit-value (Item-Total Correlation) measures how well a particular item (i) correlates (R) with the total (t) score of the exam. In simpler terms, it shows whether candidates who score well on this question tend to score well overall on the exam.
A higher Rit-value indicates that the item is a good discriminator, meaning that candidates who do well on the exam are more likely to answer this item correctly.
Rir-Value
The Rir-value (Item-Rest Correlation) is similar to the Rit-value but with a slight nuance. Just as the Rit-value, Rir also assesses how well an item correlates with the overall exam performance, but it excludes the score for the item itself, making it slightly more precise for assessing item quality. The Rir-value thus measures the correlation (R) between the item (i) and the rest (r) of the exam.
- A Rit- or Rir-value of 0.2 or above is generally considered acceptable.
- Values of 0.4 and higher are ideal for item discrimination, meaning that those who perform well on the exam are more likely to answer this item correctly, while those who perform poorly are less likely to do so.
- A low value (below 0.2) suggests that the item fails to distinguish between high and low performers. For example, a math question in an exam of English will probably have a low Rit-/Rir-value.
A negative Rit- or Rir-value indicates a problem – low performers may be answering correctly, while high performers are getting it wrong. This calls for a review of the question.
Relation between p-value and Rit- or Rir-value
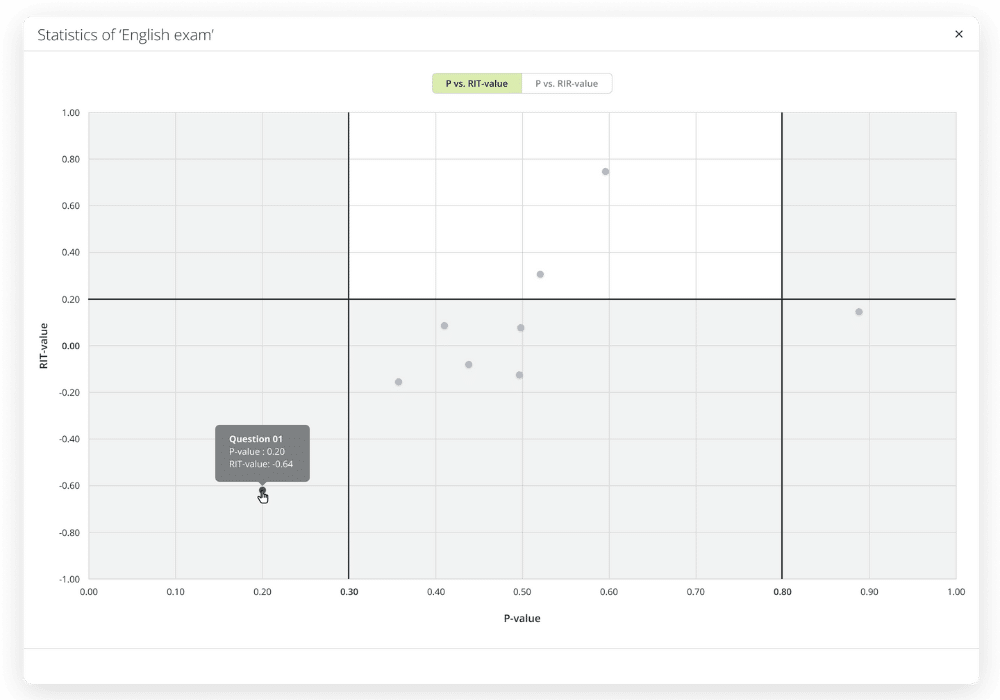
While these values are interesting on their own, they become even more insightful when you look at the relationship between the p-value and the Rit/ Rir-value.
The ‘ideal’ combination is when the p-value is moderate to high (around 0.3 to 0.7) and the Rit/Rir-value is moderate to high as well (around 0.2 or higher). This suggests a balanced item that is not too easy and not too hard but also discriminates well between high and low performers.
However, this does not mean that all other combinations are indicators of a poor item. It is necessary to take a closer look and assess why a particular item does not perform ideally in a specific context.

Examples:
Items with a high p-value (e.g., 0.8) and high Rir/Rit-value (e.g., 0.5) suggest easy questions that still differentiate well between high and low performers. They can help to identify candidates who perform consistently across the exam. However, these items might not be challenging enough in the context of a higher-level assessment.
Items that have a low p-value (e.g., 0.2) and a high Rit/Rir-value (e.g., 0.5) indicate difficult questions that differentiate well between high and low performers. An example is a complex problem that very few candidates answer correctly, but those who do tend to score well overall. This does not automatically mean that the item is poor, because it can still be useful in a challenging exam for assessing advanced knowledge or skills.
A-value
The a-value is only applicable in multiple choice questions and indicates the attractiveness of a distractor (incorrect answer choice in a MC item).
For example: if most candidates choose one specific incorrect answer, the distractor might be misleading or too similar to the correct answer.
- An a-value of 0 means no candidate chooses the distractor,
- an a-value of 1 means all candidates choose it.
Ideally, distractors should have an a-value greater than 0.05 but lower than the p-value.
Cronbach’s alpha
Cronbach’s alpha measures the exam’s internal consistency – essentially, how well all the questions work together as a cohesive test.
The rule holds: the higher the value, the better the exam. The range of the value goes from 0 to 1.
- A high Cronbach’s alpha (above 0.7) suggests that the exam is reliable,
- a low alpha (below 0.6) indicates that the exam lacks internal consistency.
Most examiners use 0.8 as the threshold for high-stakes examinations. An exam with a low Cronbach’s alpha of 0.4 indicates that it is an unreliable exam, meaning that the scores of a second exam would be significantly different from the scores of the first exam although both were administered in similar conditions.
Standard deviation
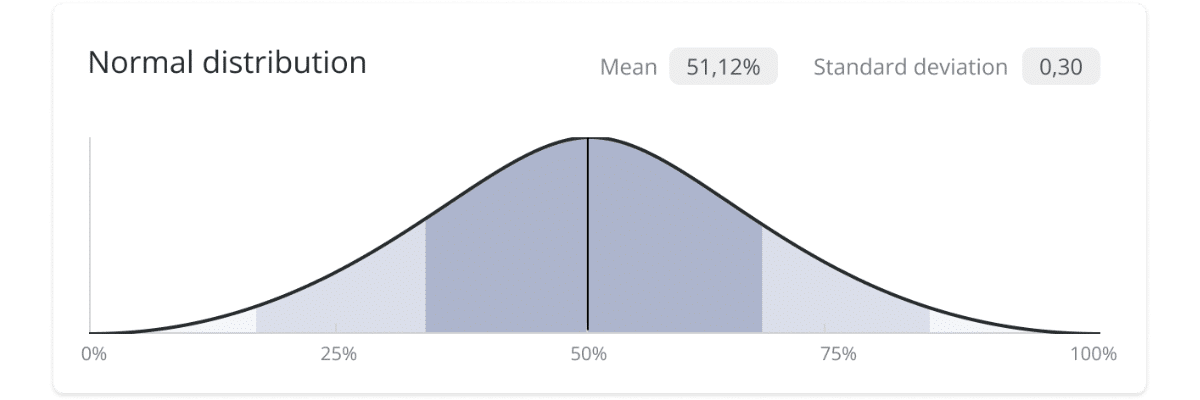
Standard deviation measures the spread of scores around the mean. A low standard deviation means that candidates scored similarly, resulting in a narrow curve, while a high standard deviation implies a wide range of scores.
Cronbach’s alpha and standard deviation provide insights into both the reliability of the exam and the variability of the candidates’ performance.

Good to know
Psychometric data is obviously more reliable when the sample size is big. The minimum number of candidates should be around 50, though this can vary depending on the context. If the number is lower than 50, then you need to look at the results with a critical eye. It is nonetheless worthwhile to investigate the values because they can provide useful insights, depending on the context.
Conclusion
Item analysis is a powerful part of exam administration that can help you improve your exams. It helps optimize existing exams, making them more consistent.
Psychometric values play a crucial role in this. The most important metrics are covered in this article.
- The p-value helps you evaluate the difficulty of a question.
- The Rit- and Rir-value reveal how well questions distinguish between high and low performers.
- The a-values provides insights into distractors’ effectiveness.
- Cronbach’s alpha and standard deviation give you a high-level view on exam reliability and candidate performance spread.
Together, these psychometric values enable you to refine your items and exams for future success.


